Aerothermodynamic analysis of a supersonic airfoil
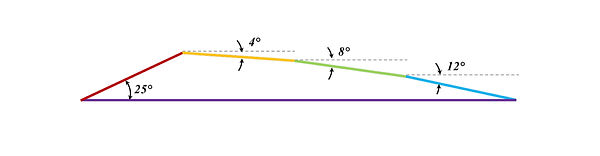
Figure 1. The airfoil that is used in the simulation is made up of four upper panels that have differing inclinations and one lower panel.
Shock-expansion and linearized supersonic theories are key methods for analyzing rigid bodies in subsonic and supersonic conditions. Shock-expansion theory models rapid compression across shock waves, causing pressure to rise, while expansion waves reduce static pressure. Linearized supersonic theory assumes uniform free-stream flow, introducing velocity perturbations downstream, and allows aerodynamic coefficients—pressure, lift, and drag—to be calculated based on Mach number, angle of attack, and body geometry. However, linearized supersonic theory is less accurate at higher angles of attack, where shock-expansion theory is more reliable. Using the airfoil shown in figure 1, me and my team conducted an analysis using the two theories.
Seen in figure 2, the airfoil is segmented into six sections which are evaluated at Mach 4 to determine its aerodynamic properties, including lift, drag, and other relevant parameters. The analysis was performed for various angles of attack.
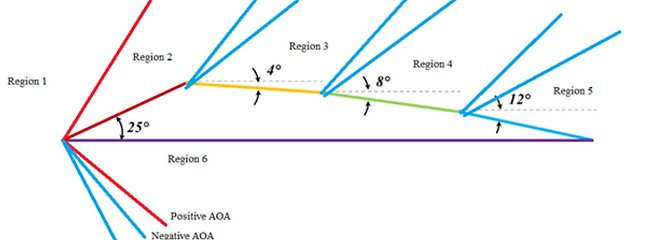
Figure 2. The segmented sections where the freestream flow is affected
Utilizing MATLAB we were able to create an animation that demonstrates the generated shock waves at the different angles of attack as shown in figure 3. Additionally, it showcases the lift and drag calculated with the larger values increasing in length
Figure 3. Video of the airfoil at different angles of attack
As seen in figure 4, the shock expansion theory results showed that pressure ratios decreased to zero for the top four sections and dropped to 2.5 for the bottom section as the angle of attack increased.
Conversely, the linearized-supersonic theory exhibited linear pressure ratios for the bottom section and the first top section, with pressure ratios jumping to one for the upper sections due to flow separation. This value of one arises from the theory’s assumption that negative pressure ratios equate to one because of flow detachment.
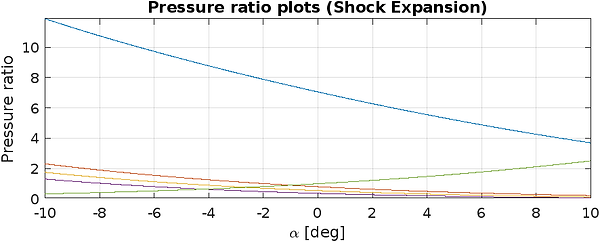

Figure 4. Plots of the pressure ratios of each plate modeling both theories